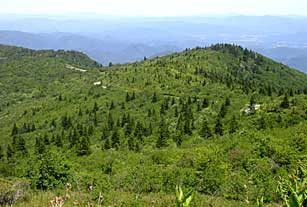
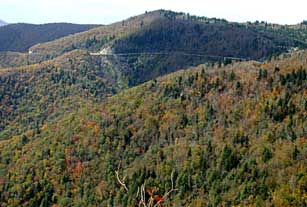
Extending 469 miles along the south & central Appalachians, the Blue Ridge Parkway connects Shenandoah & Great Smoky Mountains National Parks.
Under the direction of the University of Georgia Center for Remote Sensing and Mapping Science (CRMS) we were contracted to map its vegetation in 2003.
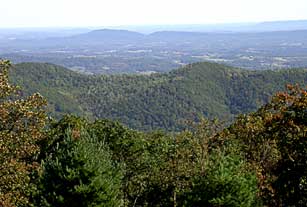
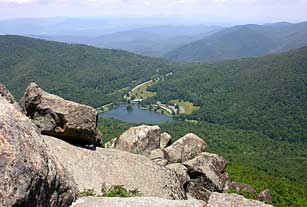
Not only does the parkway have vast ranges in elevation, from 649 to 6,047 feet, but it extends north/south through two states, VA and NC.
Seasons and plant blooms vary depending upon one's elevation and north/south position. Fall in VA is weeks earlier than in NC.
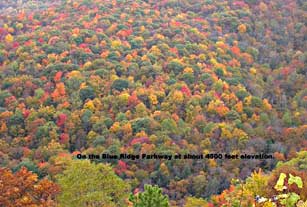
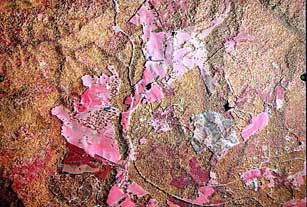
We interpret from infrared aerial photographs which ideally are taken in fall with brilliant leaf color. The colors provide a big clue to species identification.
Here is an infrared photo showing a lot of leaf change. In infrared, green shows up as pink while yellow registers as white; red becomes yellow.

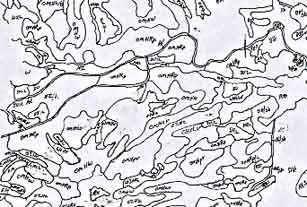
In the above infrared aerial photo, lines are drawn around the plant communities. Easiest to see are the pink areas which are designated G for graminoid.
This is an attributed overlay without the photograph. Writing in the polygons signifies plant communities or combinations of them.
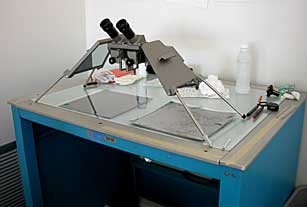
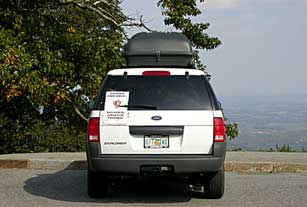
Plant communities are drawn and attributed on a light table. The stereoscope displays vegetation in 3D which is necessary in mountainous terrain.
Photos are often not enough to designate community type. We visit difficult spots with various navigational aids such as GPS, and topographic maps.

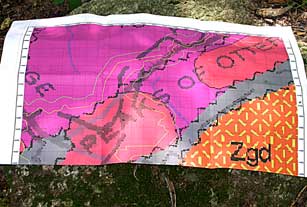
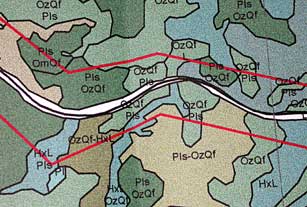
These maps were created by the Blue Ridge Parkway to assist in defining the park boundaries. They include park and buffer boundaries as well as mile markers.
Geology is often part of a plant communities' description. Maps assist us in the field and a digital map allows us to drop GPS points directly on the map.
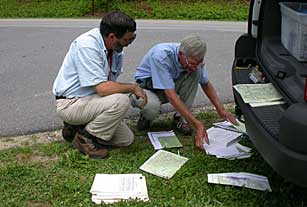
Tom Govus from Nature Serve (left) and Rick Seavey are discussing plant communities. Nature Service is responsible for defining the plant communities we use.
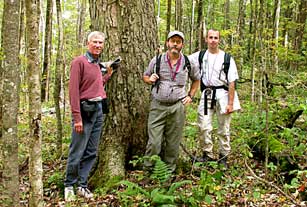
Time is spent with Nature Serve visiting plant communities. Here Rick, Tom, and Rickie White (Tom's boss) stand beside an old growth yellow birch.
Above, the gang is in a plant community needing clarification. We often find spots with no community designation necessitating a group visit if possible.
With over 145 different community types, a database was designed to assist. We select canopy & understory species; the computer gives community possibilities.
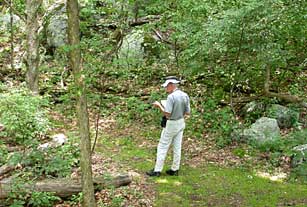
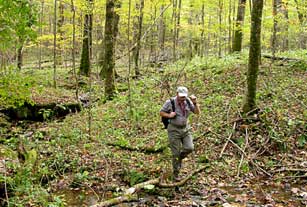
Most hiking is on our own. Here Rick is taking a GPS point. We record the point in a notebook with a description of plant species or community if known.
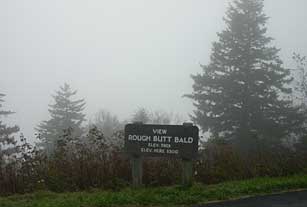
These are the frustrating days. The high mountains of this beautiful parkway are often covered in rain and/or fog with no visibility of trees, let alone species.
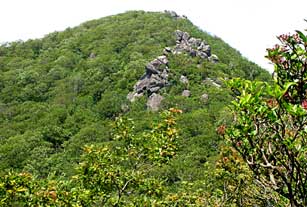
Most of our ground truthing is the "quickly check both sides of the road variety", but hikes up and down mountains like the above are the most interesting.
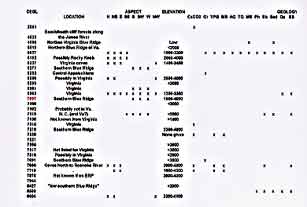
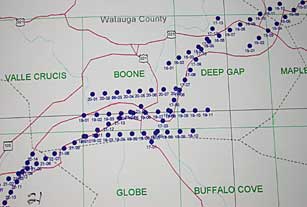
This chart of where numbered photos were taken is very helpful. It assists in locating needed photos and gives the appropriate topographic map they relate to.
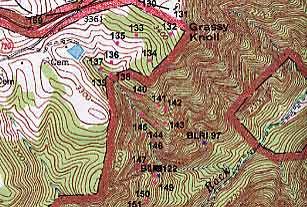
Using ArcView, field GPS points are added to appropriate topographic maps which, in conjunction with field notes, help with plant community attributions.
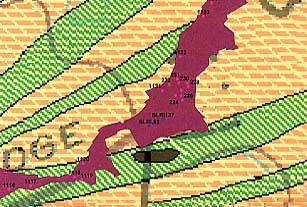
Above, GPS field points are placed on the geological map. Purple signifies the parkway. Both maps help in making the vegetation maps as accurate as possible.
This is a portion of a completed vegetation map. Made to the scale of a topographic map, the letters refer to our plant communities which are cross-walked to specific Nature Serve communities in the legend.
We determine the cross-walk with Tom, our Nature Serve contact, shown above in a rare rich northern hardwood cove. Some Nature Serve communities are too understory specific to identify from aerial photos.
Mapping the Blue Ridge Parkway is a most interesting challenge. Logically, only a small portion of the park had full fall leaf color when the infrared photos were taken. Also by extending 469 miles in a north/south direction with extreme variability in altitude the diversity of plant communities is extensive. In fact, Nature Serve contracted with the Virginia Heritage Foundation for plant community descriptions of the park's Virginia portion. In the North Carolina half alone, we dealt with 39 topographic and geologic maps and an estimated 455 infrared photos, not to mention all those plant community descriptions (145 for both states at last count).
This is only our portion of the mapping process. Upon completion overlays are sent, together with photos, to the University of Georgia CRMS lab for conversion into maps with accompanying ArcView database. (Of course, we need to coordinate closely to work out the map legend and cross-walks.) Once completed they are delivered to the National Park Service.